From Trichodesmium in the water to signals from space
Reading this carefully
- Shows
- Which absorption-guided spectral relationships survive from hyperspectral to multispectral resolution, and how a Trichodesmium Spectral Index (TSI) behaves spatially.
- Doesn’t show
- Bloom detection from a single absorption feature. Mixed communities, varying biomass and coastal optics all complicate the signal.
- Connected to
- Mixed phytoplankton communities, wide variation in biomass, and the optical complexity of coastal waters. Each can blur or mimic the bloom signal.
Our earlier work on phytoplankton typing off Kochi started with a simple question: can pigment-related features in absorption spectra still carry useful information when we move to satellite observations? That work combined microscopy, HPLC pigments, phytoplankton absorption and satellite reflectance. Fourth-derivative absorption analysis identified spectral features linked to changes in community composition, which we then explored at multispectral satellite resolution.
In our more recent work we applied that absorption-guided approach to Trichodesmium blooms in the Arabian Sea.
Here the problem was more specific. Trichodesmium has characteristic phycobiliprotein absorption, but detecting a bloom from space is not just a matter of finding one feature. Natural waters hold mixed communities, biomass varies widely, and coastal waters add optical complexity.
So we followed the signal through several stages: field-observed blooms, pigment composition, phytoplankton absorption, hyperspectral reflectance, MODIS-Aqua bands, and finally satellite-scale spatial patterns. Hyperspectral observations were convolved with MODIS-Aqua spectral response functions, and the relationships still detectable at multispectral resolution were used to build the TSI. We then compared its spatial behaviour with chlorophyll-a and used spatial analysis to distinguish cyanobacterial hotspots from other high-biomass waters.
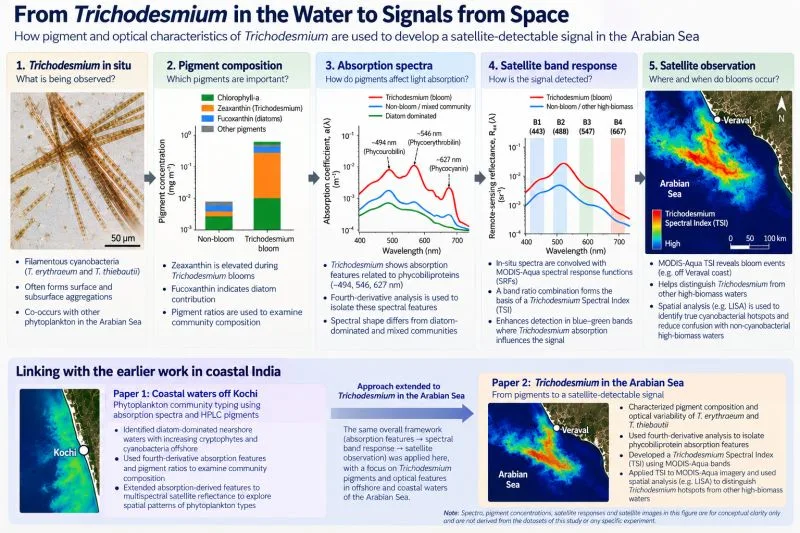
Paper: Optical variability of Trichodesmium erythraeum and T. thiebautii blooms in the Arabian Sea: from pigments to satellite signals. Remote Sensing Applications: Society and Environment 43, 102251 (2026). doi:10.1016/j.rsase.2026.102251